Clustering molecular sequences based on the level of similarity can give information on the number and diversity of species, and is a very commonly used approach for assessing species level diversity in many taxonomic groups. The number of available multi-gene datasets is growing rapidly, although the literature is currently dominated with single gene analyses, with remarkably little discussion of integrated species clustering using multi-locus dataset.
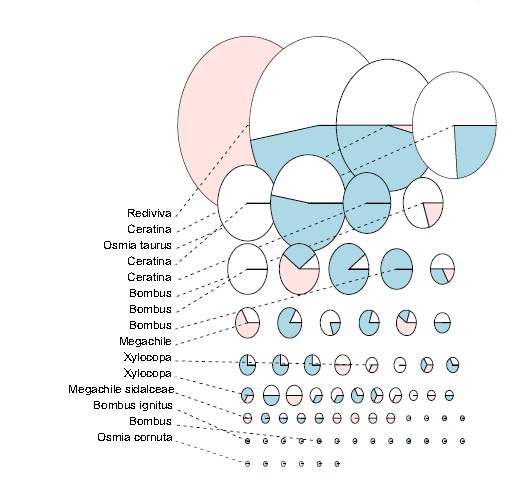
Dr Douglas Chesters finished his 2-year postdoc in Prof. Chao-Dong ZHU’s lab (zhucd@ioz.ac.cn) and got a position as the assistant professor on molecular systematics in the same lab at the Key Laboratory of Systematics and Evolution (CAS), Institute of Zoology, Chinese Academy of Sciences. He collaborated with colleagues in the same and other institutions, reporting a new heuristic approach for clustering multi-gene sequence data at the species level. The approach uses standard species clusters at each gene under study, but these are then combined in a novel way, which looks for parameters producing the best set of combined species entities during a search procedure. The authors use a number of test datasets, including a newly sequenced 3-gene dataset of bee specimens collected from an apple orchard in Beijing. Figure 1 shows an example, with the results for the clustering of three genes and 250 bee specimens, with the method estimating 70 species units, and giving automated taxonomic labels in some cases. The authors demonstrate the usefulness of the approach for estimating species diversity of medium to large multi-gene datasets, although finding high disagreements between the species hypotheses formed particularly at the 28S gene.
The study should become quite relevant as surveys of species diversity switch to multi-gene methods. The paper has been accepted and on-line by Methods in Ecology and Evolution (http://onlinelibrary.wiley.com/doi/10.1111/2041-210X.12104/abstract).

A novel approach to speciesclustering of multi-gene datasets applied to sequence data from Beijing bees. Each pie chart gives a single species unit, with the size proportional to the number of sequences comprising the species unit. They are colored according to genes represented, where blue segments = CytB, white = COI, red= 28S. The results suggest 70 species units in total.
Dr. Douglas Chesters (dchesters@ioz.ac.cn) provided the summary of this coming paper

